DNY59
Introduction
Recently, I signed up for a monthly newsletter from Current Market Valuation, a site dedicated to utilizing various mathematical models to gauge the valuation of the stock market using various economic data points. Many of the models employ standard deviations from historical data to determine if the state of the stock market is undervalued, fairly valued, or overvalued. Based on the site’s most recent reports, combined with additional data from the Federal Reserve, it appears that we are in a definitive stock market bubble.
Introduction To The Buffett Indicator
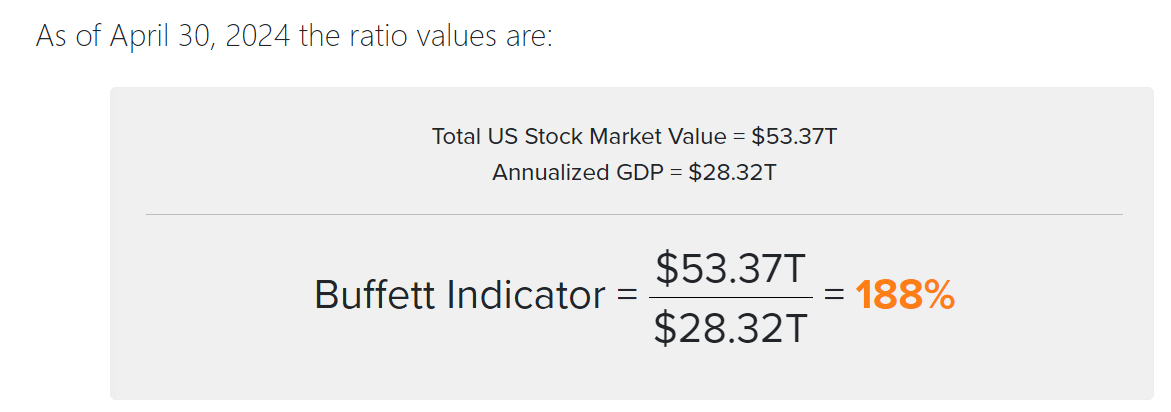
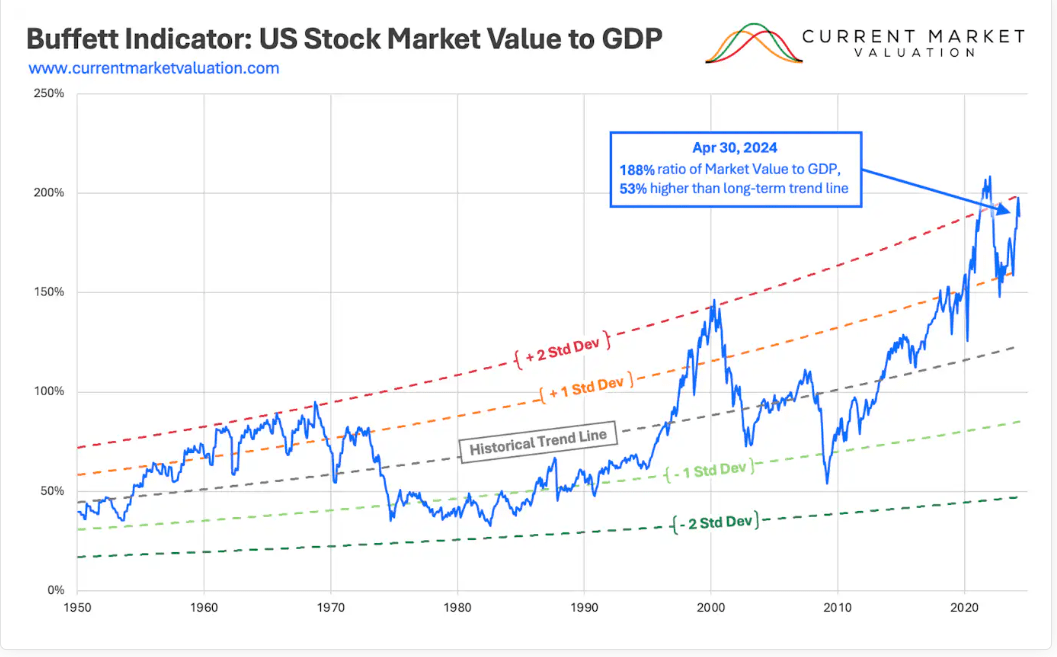
The Buffett Indicator is a simple ratio where the total market value of the US stock market is divided by annualized GDP. Using the most recent data, this ratio comes to 188%, which is the second-highest level recorded, just slightly lower than the post pandemic rally. While the ratio is historically high, those who track this model use an exponential regression line to employ the historical trend, and believe that over the long term, the ratio should naturally rise due to “new technology creating more efficient returns from labor and capital.”
Current Market Valuation Current Market Valuation
Despite the exponential regression line allowing for the growth of this ratio, the Buffett Indicator currently stands at nearly two times the standard deviation, which is slightly lower than 2021, the dot com bubble, and a couple of short periods in the late 1960s, but otherwise higher than any other point in time. The historical trend line indicates fair market value at 123% of GDP as of today, implying the equity markets would need to sell off by 30% to reach those levels.
Incorporating Interest Rates
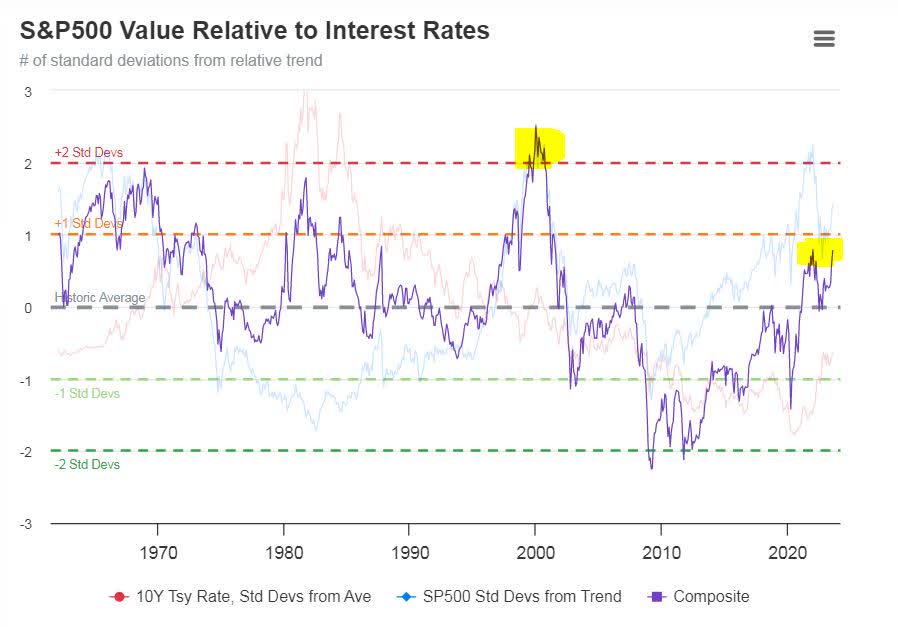
One criticism of the Buffett Indicator is it does not incorporate interest rates, which are a huge influence on asset prices. Fortunately, Current Market Valuation has other models that do use interest rates. One model takes the relative value of the S&P 500 against the relative value of the ten-year Treasury rate. This is done by taking the standard deviation of the S&P 500 and deducting the standard deviation of the ten-year Treasury rate.
While the relative value comes in at 1 standard deviation and has the market as overvalued, it may surprise investors that the interest rate standard deviation is negative. This is because of the history of much higher interest rates prior to 2000. Essentially, the current interest rate level is seen as less restrictive on a historical basis compared to what we may believe today.
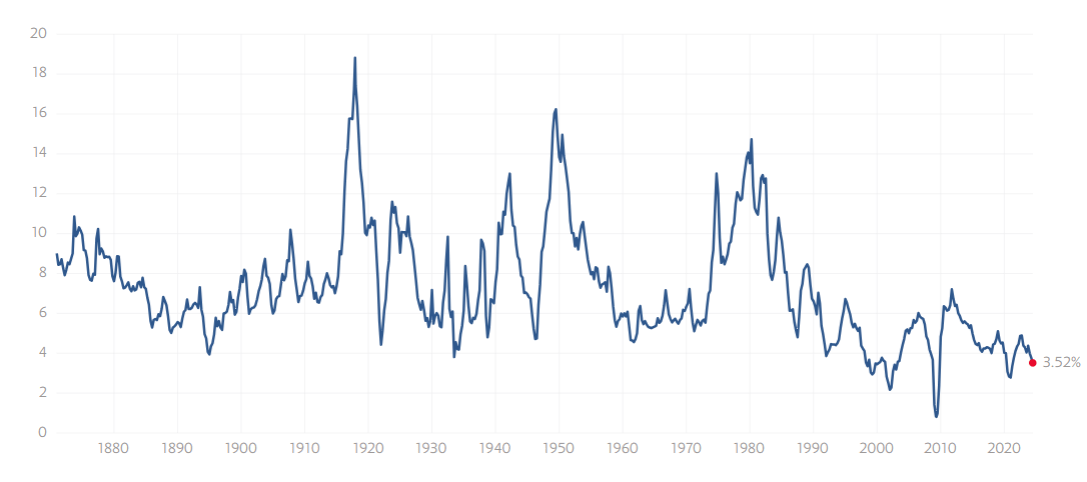
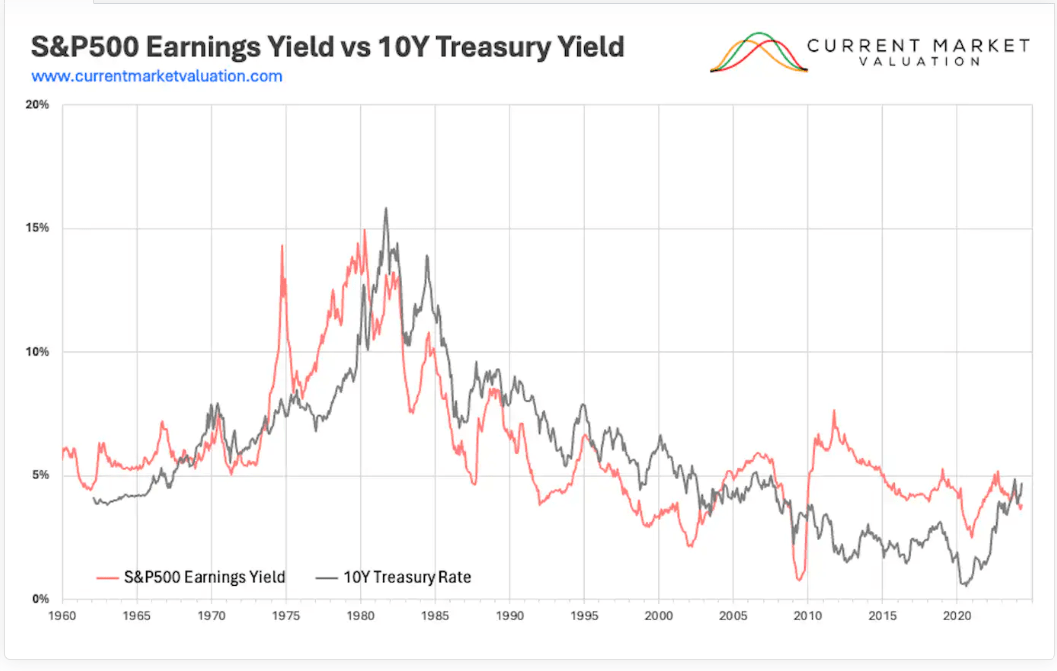
Another comparison is to look at the earnings yield of the S&P 500 against the ten-year Treasury rate. The earnings yield is the return on investment that an investor can expect if earnings were to not grow and are calculated at an inverted rate of the P/E ratio (for example, a PE ratio of 20 would coincide with an earnings yield of 5%). The earnings yield of the S&P 500 is currently below 4%, which is abnormally low and shows that the S&P 500 has been appreciating at a faster rate than earnings growth.
When the earnings yield is compared against the ten-year treasury rate, the treasury rate recently rose above the earnings yield for the first time since the financial crisis. But because the treasury yield is not excessively higher, Current Market Valuation considers it within the normal standard deviation of a fairly valued equity market. I would caution investors to be mindful of higher returns on fixed income having the potential to shift new capital away from equities and into bonds and creating corresponding volatility.
Earnings Growth
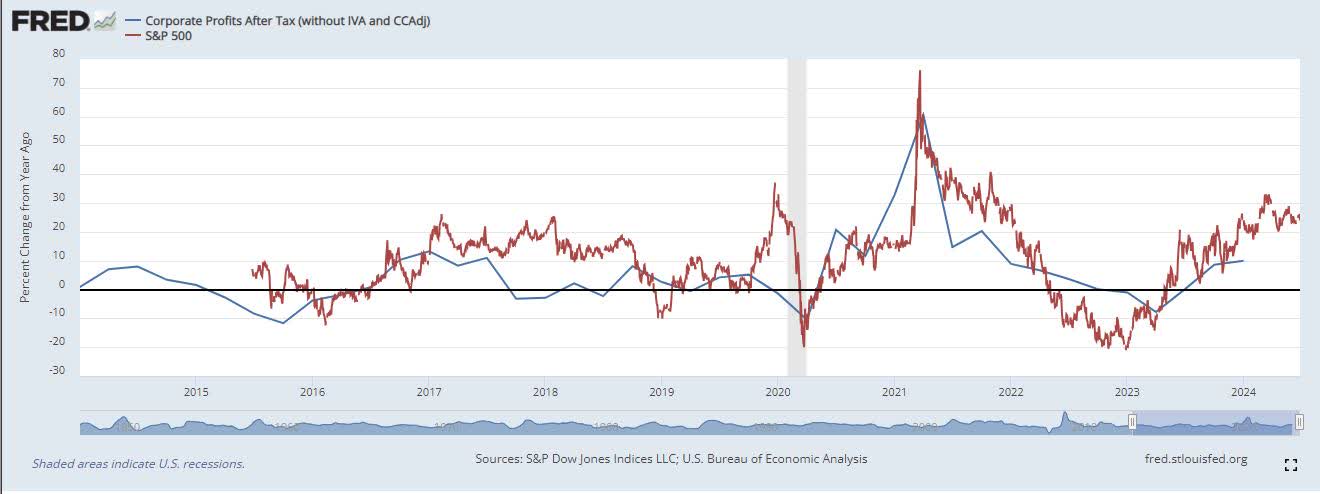
While various factors can cause the equity markets to fluctuate day-to-day, nothing has a more long-term influence over the markets than earnings growth. The S&P 500 is currently running at 20% to 30% annual growth rates, while first quarter corporate earnings growth was just revised to slightly under 10%. The level of growth in the S&P 500 relative to earnings growth tends not to last long, and current trends suggest upcoming market volatility.
S&P Dow Jones Indices LLC, S&P 500 [SP500], retrieved from FRED, Federal Reserve Bank of St. Louis; https://fred.stlouisfed.org/series/SP500, June 27, 2024.
Not All Equities Are Created Equal
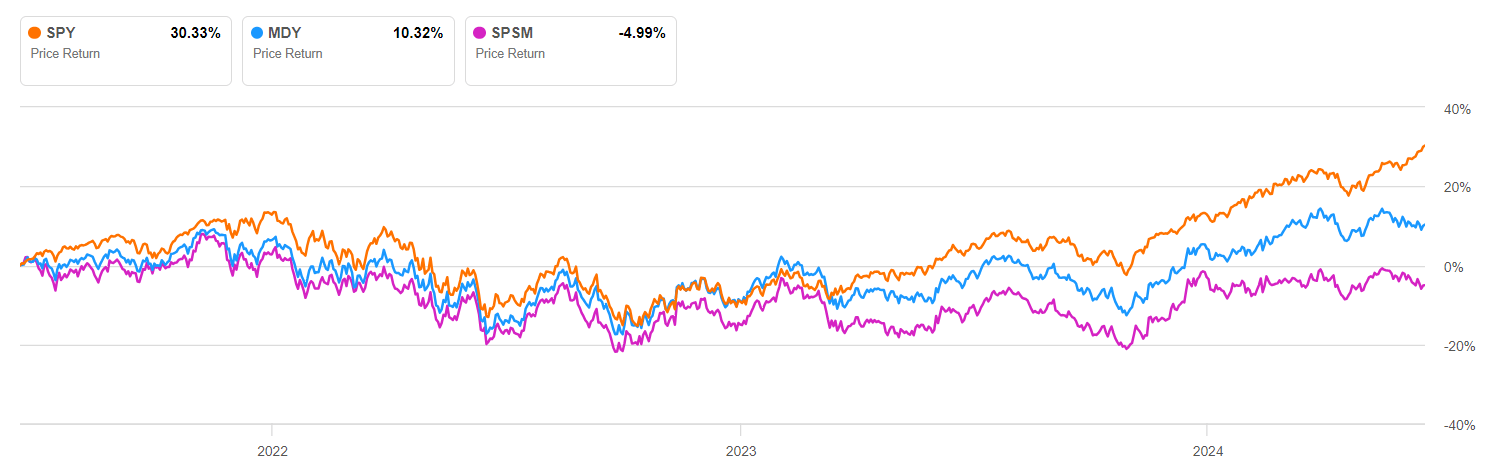
When examining the performance of different equities, there are extreme differences. Over the past three years, large cap stocks have far outperformed middle cap and small-cap stocks. In fact, the separation between the three has really opened over the past year. Investors who are looking to enter equities at this point may want to look at small-cap opportunities, which have declined over the last three years versus large caps, which are 30% higher.
Conclusion
Investors…
Read More: Nearing Full Froth: A Look Inside The Current Market Bubble